Explore, Compare, Visualize datasets online
Engineered for developers, data scientists, and analysts. Understand, diff, and visualize your most complex data structures instantly—no setup, no code, just insights.
Experience the Workflow
...or watch the walkthrough
Built for Modern Data Workflows
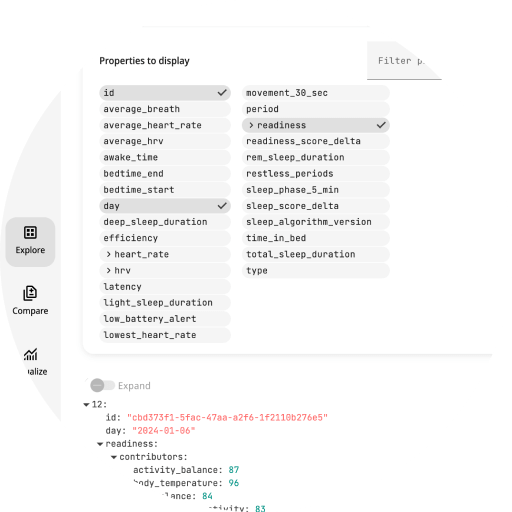
Deep Data Intelligence
Stop manual inspection. Experiri provides a surgical view into your JSON, NDJSON/JSONL, CSV, and TOON datasets.
Our engine automatically infers schemas and maps data types across deeply nested structures of arbitrary depth.
Dealing with high-volume or compressed data? We natively support Gzip and Zstandard decompression right in your browser, ensuring your workflow remains local and private.
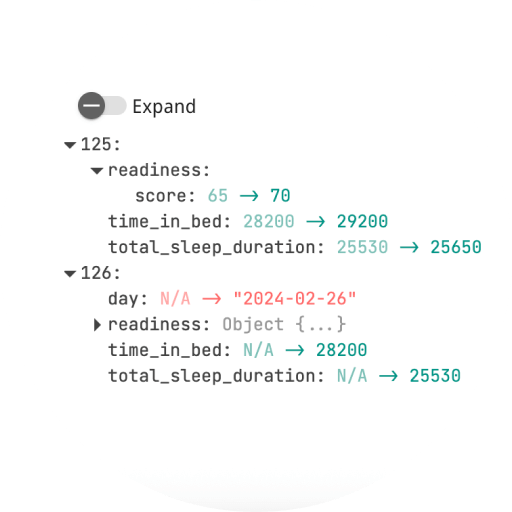
Structural Diffing at Scale
Standard diff tools fail on rich, structured data. Our comparison engine is built for hierarchy, allowing you to track changes across multiple dataset versions side-by-side.
Isolate deltas with intelligent filters that automatically adapt to your data's schema. Identify modifications in even the largest arrays and nested objects effortlessly.
See the evolution of your state: track both original and updated values for every property and array item with clear, high-contrast highlighting.
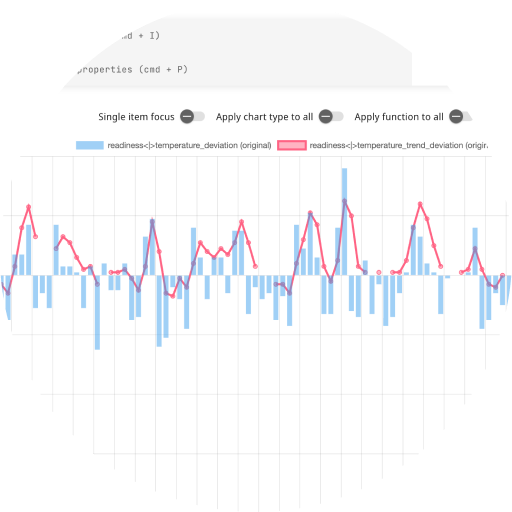
Zero-Config Visual Analytics
Transform tabular and nested data into compelling stories with no code required. Bridge the gap between raw logs and actionable intelligence.
Calculate critical statistical metrics—mean, median, mode, standard deviation, variance, and more—and plot them instantly.
Choose from a comprehensive suite of performance-optimized visualizations: bar charts, line charts, scatter plots, histograms, bubble charts, radar maps, and beyond. Only your data sets the limit.